I thought I’d put up a quick post with an interesting chart that might provide some food for thought. Considering the volatility in the past few days that was created by the surprising results of the “Brexit” referendum where the U.K. voted to leave the European Union, I thought this might be a timely topic to think about. In the past I’ve discussed how sometimes even the largest cap stocks can get mispriced from time to time (see here and here).
I was preparing a slide presentation recently for a friend of mine at Google who is in charge of a value investing club for Google employees (and also the person who organizes the outstanding Investor Talks at Google series). One of the topics I was commenting on was the idea that even large cap stocks can get significantly mispriced from time to time. Some people refer to this concept as “Time Arbitrage”—basically being able to look out 2-3 years when much of the market is focused on the next quarter or two. I think this behavioral concept is the largest advantage that individual investors have—should they choose to capitalize on it.
Large caps might often seem fairly priced (or “efficiently” priced). But taking a look at the fluctuations of the past year (which saw a 10%+ correction, but one that is not at all uncommon by historical standards), it is clear that there are potential opportunities that are served up by Mr. Market among even the biggest of all mega-caps.
It is interesting to note that as I updated this chart from the one I used in my presentation just two months ago, the top company on the list has seen its market cap decrease by roughly $100 billion and three other companies have seen their market values fluctuate by $30 billion or more—all in just two months.
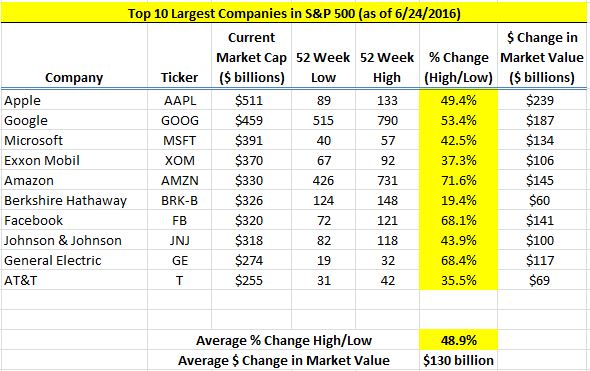
Here is a chart of the top 10 largest companies in the S&P 500, and the percentage change as measured by its 52 week high vs. its 52 week low:
So the average gap between the yearly high and low price is nearly 50% for these ten mega-cap companies, or an average yearly change in market value of $130 billion. Pretty remarkable.
8 of the top 10 companies saw their market values fluctuate by $100 billion or more. Many of these businesses have very stable earning power with mature, slow-changing business models. It is remarkable to me that a company like Johnson and Johnson can see a $100 billion fluctuation in value between its 52 week high and its 52 week low. Of course, these fluctuations are often correspond very closely to the fluctuations in the overall market, but the fact is that there is almost no chance that a company like JNJ is worth $225 billion in one month, and a few months later is worth $325 billion. There isn’t that much that changes in the course of a few months in most companies of this size.
It should be said that this doesn’t mean that one of these two prices represents a big discount to fair value, it just means that if you sift through even the largest index of stocks (the S&P 500), there are bound to be some fantastic bargains from time to time—even in the largest companies in the world.
As I mentioned in the post on Einhorn’s book, I can categorize market inefficiencies that come from two main sources (there are others, but these are the primary two sources in my experience): Disgust and Neglect.
Companies that get neglected (or haven’t been followed in the first place) are where many opportunities come from. These are often the small or micro-cap companies that can be discovered by diligently turning over rocks.
The large cap companies are not neglected by any means, but they can occasionally become just as mispriced through disgust, or pessimism. The ability to adopt a frame of mind that focuses on a longer time frame (and the variables that impact the outcome over such time frame) is what is required to capitalize on this category of mispricing.
There are obviously opportunities in smaller companies that are several magnitudes greater than in large caps, but my general point in displaying the largest companies is really just to demonstrate that even the stocks of the biggest companies can get mispriced by a not-so-insignificant degree at times.
John Huber is the portfolio manager of Saber Capital Management, LLC, an investment firm that manages separate accounts for clients. Saber employs a value investing strategy with a primary goal of patiently compounding capital for the long-term.
John also writes about investing at the blog Base Hit Investing, and can be reached at [email protected]

