I am in the midst of writing a few posts on the importance of Return on Invested Capital (ROIC). I wrote two posts last week discussing Greenblatt’s formula and some thoughts on the topic (Here and Here). I’ll have one or two more posts next week discussing a few brief examples of compounders (companies that exhibit unusually high returns on capital over extended periods of time, allowing them to grow–or “compound”–shareholder value over long periods of time).
There always seems to be a strong divide between “value and growth“, deep value (aka cigar butts) and quality value, etc… I too have mentioned these differences numerous times. And it’s true that many investors can do well simply buying great businesses at fair prices and holding them for long periods of time, while other investors prefer to slowly and steadily buy cheap stocks of average quality and sell them as they appreciate to fair value, repeating the process over time as they cycle through endless new opportunities.
The styles are different, but not as different as most people describe them to be. The tactics used are different, but the objective is exactly the same: trying to buy something for less than what its really worth. Both strategies rely on Graham’s famous “margin of safety” concept, which is probably the most important concept in the investing discipline.
Both Quality and Valuation Impact Margin of Safety
The margin of safety can be derived from the gap between price and value, and it can also be derived from the quality of the business. The latter point is really part of the former… For example, a business that can steadily grow intrinsic value at a rate of say 12% annually is worth much more than a business that is growing its value at say 4% annually–all other things being equal. And since the higher quality compounder is worth more than the lower quality business, the quality compounder offers a larger margin of safety.
Of course, in the real world, it’s not that easy. The lower quality business might offer an extremely attractive discount between current price and value, which is significant enough to make the investment opportunity preferable to the compounder. This is often the case in real life–compounders are rarely are offered cheaply.
But too often, value investors get enticed by cheap metrics and seemingly large discounts between price and value in businesses with shrinking intrinsic value. The problem in these types of cigar butts is that the margin of safety (gap between purchase price and value) is largest the day of the investment. Every day thereafter the business value slowly erodes further, making the investment a race against time.
Now, not all cheap stocks have eroding intrinsic value. On the contrary, many high quality, or average quality businesses are occasionally offered quite cheap. But in my opinion, it’s always much more reassuring to be invested in businesses that have intrinsic values that are growing over time, as it allows for larger margins of error in the event that you’re wrong, and better returns in the event that you’re right. A couple days ago I read a quote somewhere that I believe Allan Mecham said that I’ll paraphrase: If investors focused on reducing unforced errors as opposed to hitting the next home run, their returns would improve dramatically.
So it’s like the amateur tennis champion that wins because they had the fewest mistakes, not necessarily the most forehand winners.
Reducing Unforced Errors and Buffett’s 1987 Roster
One way to reduce unforced errors in investing is to carefully choose the businesses that you decide to own. The gap between price and value will ultimately determine your returns, but picking the right business is one important step in reducing errors.
One way to reduce errors is to focus on studying high quality businesses with high returns on capital. In the last post, I mentioned an article that Buffett referenced in the 1987 Berkshire shareholder letter. In this letter, Buffett mentions that Berkshire’s seven largest non-financial subsidiary companies made $180 million of operating earnings and $100 million after tax earnings. But, he says “by itself, this figure says nothing about economic performance. To evaluate that, we must know how much total capital – debt and equity – was needed to produce these earnings.”
So Buffett was interested in return on invested capital. However, he goes on to state that these seven business units used virtually no debt, incurring just $2 million of total combined interest charges in 1987, so virtually all capital employed to produce those earnings was equity capital. And these 7 businesses had a combined equity of only $175 million.
So Berkshire had seven businesses that combined to produce the following numbers:
- $178 million pretax earnings
- $100 million after tax earnings
- $175 equity capital
- 57% ROE
- 102% Pretax ROE
So Buffett’s top 7 non-financial businesses produced fabulously high returns on equity with very little use of debt. In short, they were outstanding businesses. Buffett proudly goes on to say that “You’ll seldom see such a percentage anywhere, let alone at large, diversified companies with nominal leverage.” Of course, investor returns depend on price paid in relation to value received, and we are only discussing the value received part of the equation here.
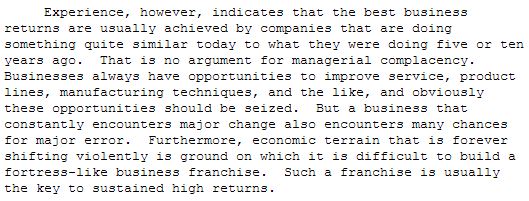
Buffett then voices his opinion on the importance of predictability and stability in business models:
He then references an interesting study by Fortune that backs up his empirical observation. In this study, Fortune looked at 1000 of the largest stocks in the US. Here are some interesting facts:
- Only 6 of the 1000 companies averaged over 30% ROE over the previous decade (1977-1986)
- Only 25 of the 1000 companies averaged over 20% ROE and had no single year lower than 15% ROE
- These 25 “business superstars were also stock market superstars” as 24 out of 25 outperformed the S&P 500 during the 1977-1986 period.
The last statistic is remarkable. Even in the really high performing value baskets such as low P/B or low P/E groups, you’ll typically see a ratio of around one-half to two-thirds of the stocks that outperform the market. Sometimes you’ll even have a majority of underperformers that are paid for by a few large winners in these basket situations. But in this case, even with a small sample space, it’s pretty telling that 96% of the group outperformed over a period of meaningful length (10 years).
Of course, this begs a question along the following lines: “Great, by looking in the rear view mirror, it’s easy to determine great businesses… how do we know what the next 10 years will look like?”.
Buffett again provides some ideas:
The idea is to locate quality businesses in an effort to reduce unforced errors. Again, one way to do this is to focus on valuation alone. I think Schloss implemented this method the best. Another way is to study compounders and be disciplined to only invest when the valuation aligns with your hurdle rate.
And in terms of percentages, there will likely be fewer errors made (fewer permanent capital losses) in the compounder category than there will be in the cigar butt category. It doesn’t mean one will do better than the other, as higher winning percentage doesn’t necessarily mean higher returns. But if you want to reduce unforced errors (reduce losing investments), it helps to get familiar with stable, predictable businesses with long histories of producing above average returns on invested capital.
So circling back to the compounders… and the question of: “Yeah the last 10 years are great, but how do we find the winners for the next 10 years?” One possible place to look would be to glance at the same list that Fortune put together. I attempted to recreat the Fortune list in Morningstar based on the last 10 years (2004-2013). As I’ve mentioned before, I keep a few quality lists at Morningstar including:
- Non-financial stocks that have grown revenues and maintained positive earnings for 10 consecutive years (81 stocks, less than 1% of the database)
- Non-financial stocks that have produced positive free cash flow in each of the last 10 years (596 stocks, 6% of the database)
- Stocks that have produced returns on equity of 15% or more in each of the last 10 years (143 stocks, or just over 1% of the database)
My attempt to recreate Fortune’s list will fall short, because I can’t easily determine the average ROE of these 143 businesses, but this list would be a good place to start looking. Many of these stocks have performed very well in the past 10 years, just from glancing at the list.
And it’s worth noting that this list is the previous 10 years, it doesn’t mean that these stocks will maintain their strong returns on equity over the next 10, although research shows that most strong businesses tend to remain strong over time (mean reversion plays much less a role than is commonly assumed).
So it might be worth checking out this list, and keeping it as a watchlist for quality companies that might become available at low prices at some time or another. Or use it as a list to go through one by one, learning about successful business models in the process.
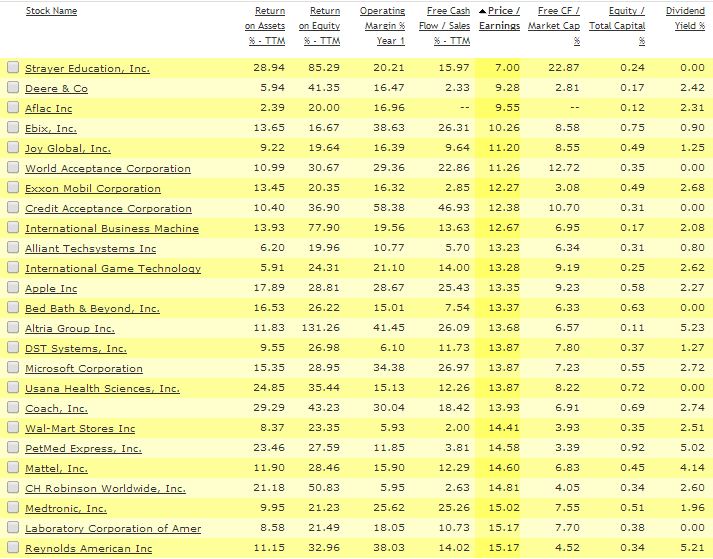
Here is a look at the list of consistent ROE stocks sorted by lowest 25 P/E ratios:
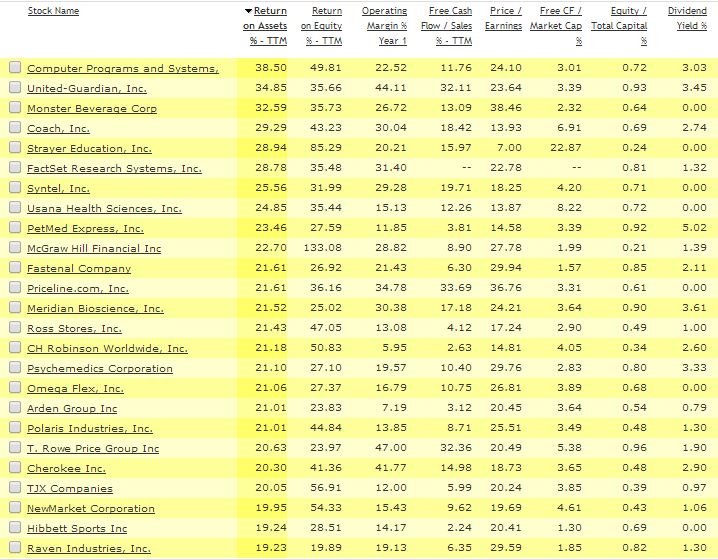
Here is a look at the same list of 143 stocks that have produced 15% ROE in each of the past 10 years, this time sorted by highest Returns on Assets:
Remember, all of these firms have achieved at least 15% ROE in each of the past 10 years, something 99% of public companies failed to do. This list certainly contains stocks that aren’t undervalued (many are quite expensive), but it’s probably a good list to keep an eye on from time to time, as it certainly contains a healthy amount of businesses with compounding intrinsic values.


